Before we discuss the Importance of using the Info graphics, we should first know what it is all about.
What is Info graphics?
Infographics or infographics are graphic visual representations of information, data or knowledge intended to present complex information quickly and clearly. They can improve cognition by utilizing graphics to enhance the human visual system’s ability to see patterns and trends.The process of creating infographics can be referred to as data visualization, information design, or information architecture. (Google)
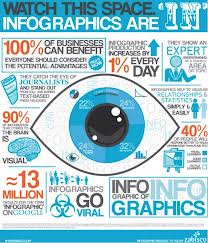
It is used to describe the data or information with pictures or images. It is also more preferable to use because it can emphasize what the data or information is all about. Also, for the readers/ audiences to not get bored in reading the information, they can easily understand the information you wanted to convey through from the pictures/ images used. it is the new way to make them understand the information than reading so many texts of information. It is easy more to use and it is also one way to catch the attention of the readers, using this method/way, the information will retained and get easily remembered by the readers/ audiences.
Infographics have been around for many years and recently the proliferation of a number of easy-to-use, free tools have made the creation of infographics available to a large segment of the population.
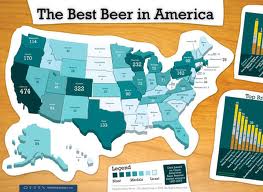
In newspapers, infographics are commonly used to show the weather, as well as maps, site plans, and graphs for statistical data. Some books are almost entirely made up of information graphics, such as David Macaulay’s The Way Things Work. The Snapshots in USA Today are also an example of simple infographics used to convey news and current events.
Modern maps, especially route maps for transit systems, use infographic techniques to integrate a variety of information, such as the conceptual layout of the transit network, transfer points, and local landmarks. Public transportation maps, such as those for the Washington Metro and the London Underground, are well-known infographics. Public places such as transit terminals usually have some sort of integrated “signage system” with standardized icons and styliz.(Google)
It was already used by some of the famous individuals in their times to emphasize their works or the information/ messages they want to convey to people. Famous individuals like:
Christoph Scheiner (1626) who published the Rosa Ursina sive Sol, a book that revealed his research about the rotation of the sun; Infographics appeared in the form of illustrations demonstrating the Sun’s rotation patterns. (1790) William Playfair, an engineer and political economist, published the first data graphs in his book The Commercial and Political Atlas. To represent the economy of 18th Century England, Playfair used statistical graphs, bar charts, line graphs and histograms. In his work, Statistical Breviary, he is credited with introducing the first area chart and pie chart and other famous people.
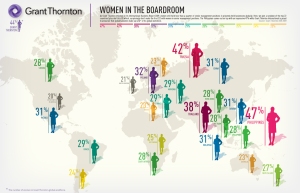
Today, it is already used by Institutions, Firms and other Establishments to deliver the Information and to advertise/ promote their Establishments and etc. It also effective to use in narrating the past, present or the future happenings of a certain place, thing, individual, and many more. To narrate the Histories and future predictions. The importance of infographics for small businesses is shown in the graphics so that people can easily identify the status of it.